x
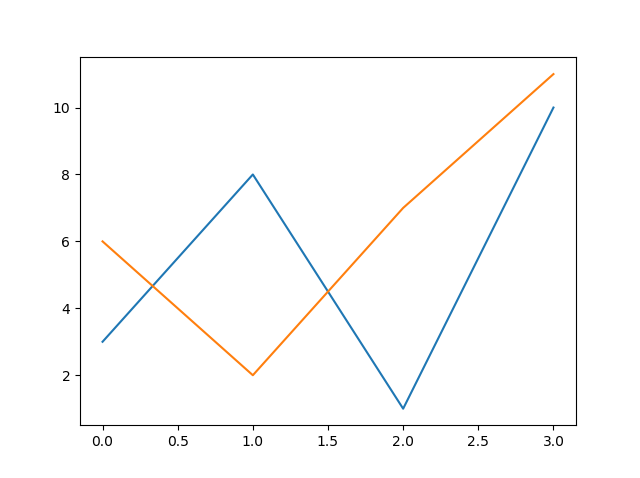
#Three lines to make our compiler able to draw:import sysimport matplotlibmatplotlib.use('Agg')import matplotlib.pyplot as pltimport numpy as npy1 = np.array([3, 8, 1, 10])y2 = np.array([6, 2, 7, 11])plt.plot(y1)plt.plot(y2)plt.show()#Two lines to make our compiler able to draw:plt.savefig(sys.stdout.buffer)sys.stdout.flush()